With smartphone and tablet usage on the rise, knowing what percentage of searches is mobile is crucial for your business.
In this article, we will go over the most important mobile search stats, usage trends and SEO facts & stats marketers should know in 2022.
Key Mobile Search Stats To Explain How Big Is Mobile Search?
- Mobile devices take up 63% of organic search visits.
- 58.16% of global web traffic originated from mobile devices.
- Google holds 93.68% of the mobile search engine market share.
- Google will be 100% mobile-first as of March 2021.
- Around 83% of people in the US are mobile internet users.
- The average daily time spent on mobile devices in the US is set to reach 4 and a half hours by 2023.
- Americans check their phones 63 times a day.
- Mobile users in the US spent $43.04 billion on in-app purchases.
- Retail m-commerce sales reached $359.32 billion in 2021.
- 79% of smartphone users have made a purchase online through their mobile phones.
- Mobile traffic converts at less than half the rate of desktops.
- 21% of consumers in the US used the internet to find a local business almost every day.
- 82% of shoppers who used their smartphone to help them shop carried out ‘near me’ searches on their mobile device.
- 93% of “near me” searches result in clicks on the first set of results.
- Weather sites get 80% of mobile searches while B2B topics get less than 50%.
- 30% of pages that come up on the first Google page on desktops do not show up in the top 10 results on mobile devices.
- less than 30% of clicks on mobile go to the first organic hit.
Mobile Search Statistics – Why Should You Consider Mobile For Marketing?
1. Mobile devices take up 63% of organic search visits.
Mobile’s share of organic search engine visits has remained over 60% for the past few years, only dipping slightly in Q1 2021 to 59 percent. The share of mobile devices of organic search engine visits, on the other hand, was the highest in 2020 at 64%. (Statista)
2. 58.16% of global web traffic originated from mobile devices.
39.37% came from desktops and only 2.47% from tablets.
Mobile has been growing rapidly throughout the years. Back in February 2012, mobile devices generated only 8.53% of global web traffic. By 2017, the percentage of web traffic on mobile increased by more than six times.
In the US, though, as of Q4 2021 desktop takes up over half of internet traffic, while mobile has a share of 47.28%, a decrease from 48.21% in the third quarter of 2021. (StatCounter)
3. Google holds 93.68% of the mobile search engine market share.
Yahoo! has a small share of 2.43%, while DuckDuckGo and bing only hold 2.23% and 1.33%, respectively.
The situation is a bit different on desktops though. Google is still in the lead, however, bing takes up 13.05% of the desktop search engine share. So, if your platform is not optimized for mobile, bing can be a good option to consider. (StatCounter)
4. Google has the highest share of organic search traffic from mobile devices.
61% of organic mobile traffic on Google originated from mobile phones. As of Q4 2019, 49% of Yahoo’s organic search traffic in the US came from mobile phones, slightly behind DuckDuckGo with 58%. bing had the smaller share of organic mobile search traffic with 23%.
What’s more, the mobile share of organic search engine visits in the United States has remained almost unchanged since 2013. (Statista)
5. Google will be 100% mobile-first as of March 2021.
Google’s mobile-first indexing uses the mobile version of the site for indexing and ranking. The process was years in the making—it started in 2016 and by March 2020, 70% of sites had switched to mobile-first indexing. Google had set a previous deadline for all sites to switch over to mobile-first indexing in September 2020, but due to the pandemic, the deadline was extended to March 2021. (Semrush)
6. 73% of search ad clicks on Google came from mobile.
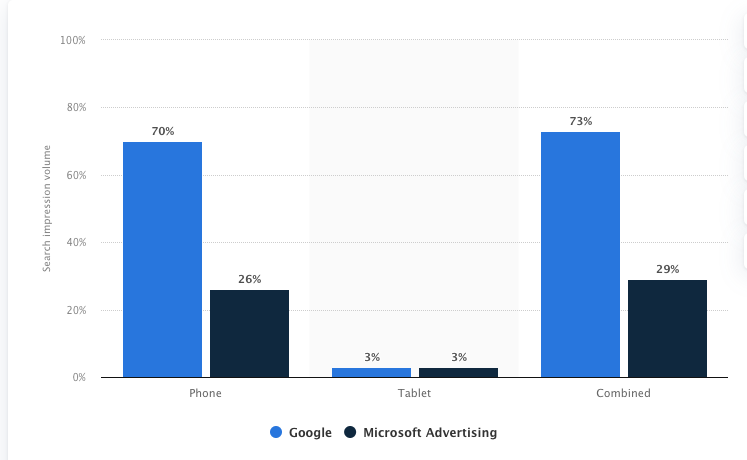
70% of search clicks on Google came from phones, while 3% of total clicks were generated by tablets. On the other hand, 29% of paid Microsoft Advertising search clicks came from mobile devices. (Statista)
Mobile Usage Statistics
7. Around 83% of people in the US are mobile internet users.
Statista estimates that in 2021, 276.8 million Americans accessed the internet through a mobile device (smartphone or tablet). The figure is expected to increase gradually over the next few years, reaching 300 million by 2026. (Statista)
8. There are 6.64 billion smartphone users in the world today.
This translates to about 83.71% of the population. In the US alone there are 270 million smartphone users or about 81.60% of the population.
The smartphone penetration rate in the US is the highest among 18-29 year-olds, 94% of whom have a smartphone. The majority of US smartphone users live in urban areas (83%), are White (77%), have a college degree (91%), and earn at least $75,000 (93%). (BankMyCell)
9. As of February 2021, around 53% of the US population had at least one tablet.
The USA is the biggest tablet market in the world, home to over 200 million installed tablet units. The installed base of tablet units is set to decrease to almost 155.3 million units by 2025, though. (Statista)
10. Apple is the biggest vendor of mobile phones in the US.
Taking up 57.58% of the market, Apple is the biggest selling smartphone vendor in the US, followed by Samsung (27.92%), Motorola (4.69%), LG (2.76%), and Google (2.45%).
Apple dominates the tablet market as well. iPads account for 54.74% of the tablet market, well ahead of Samsung with 19.94% and Amazon with 12.91%.
Since Safari is pre-installed on Apple devices, it is the most popular mobile browser in the country, taking up 53.41% of the market. Chrome is second with a 40.63% share, followed by Samsung Internet and Firefox with 3.83% and 0.88% share each. (StatCounter)
11. Average daily time spent on mobile devices in the US is set to reach 4 and a half hours by 2023.
It is estimated that US residents spent 4 hours and 9 minutes on mobile devices every day in 2022, or around 269 minutes. Time spent on mobile is expected to go up to 275 minutes (4 and a half hours) by 2023, taking up 35% of total time spent with media a day.
Spending more time on mobile than desktop is not a trend limited just to the US, though.

Time spent in-app is also rising at the expense of time spent in the browser.
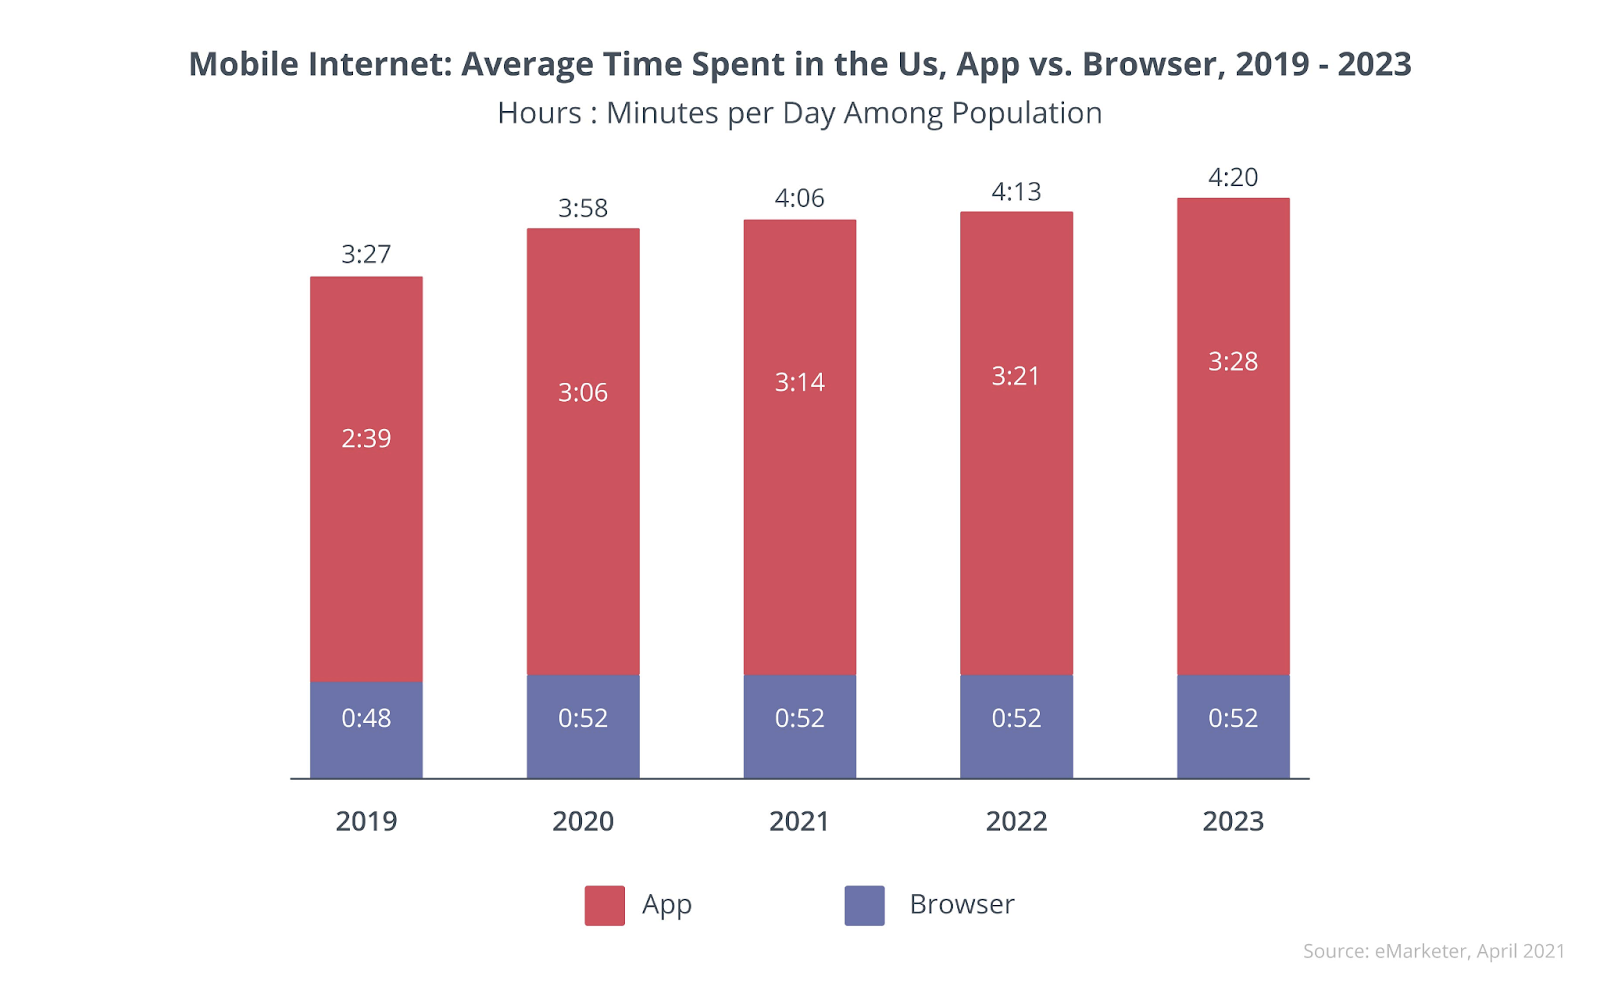
In 2022, 3 hours and 21 minutes were spent in-app as opposed to just 52 minutes in-browser. (DataReportal, Smaato)
Here are some more stats on mobile usage:
- Americans check their phones 63 times a day.
- 50% of all video views come from mobile devices.
- 47% of gaming revenue is generated from mobile gaming, while PCs only account for 25% of total gaming revenue.
- 80% of social media usage is on mobile devices and only 15% on desktops.
- 95.1% access Facebook through a mobile device. The same is true for 86% of Twitter and 60% of Linkedin users. (BroadbandSearch)
12. Mobile users in the US spent $43.04 billion on in-app purchases.
In addition, mobile users have downloaded a total of 12.19 billion apps and spent 32% more on in-app purchases between February 2022 and February 2021. (DataReportal, SemRush)
Mobile Commerce Statistics
13. Retail m-commerce sales reached $359.32 billion in 2021.
This represents an increase of 15.2% from the previous year. What’s more, by 2025 retail m-commerce sales could hit $728.28 billion and take up 44.2% of total retail ecommerce sales in the US. (eMarketer)
14. 79% of smartphone users have made a purchase online through their mobile phones.
Not only that, but 69% of people said they use their phones to help them shop.
More specifically:
- 63% use their smartphones to research products
- 62% use them to compare prices
- 56% search for coupons and deals on their cell phones
- 54% check store hours on their smartphones
- 52% use mobile phones to find alternative store locations
Using mobile for shopping doesn’t end with visits to retailers’ websites. Judging by data from OuterBox, 80% of shoppers used their mobile phones while inside a brick-and-mortar store to compare prices, look up product reviews or find alternative store locations.
Statista, on the other hand, says that 36% of shoppers worldwide use their smartphones to compare prices in-shop, while another 29% use them to research products.
Surprisingly, 16% of shoppers in physical stores used their cell phones to make a purchase. (OuterBox, Statista, Uberall)
15. Mcommerce activity is higher during the holidays—nearly 40% of all ecommerce purchases were made via mobile phone.
Almost 40% of sales on Black Friday in 2021 came from mobile devices, and the same is true for 33% of purchases on Cyber Monday. On top of that, more than half of visitors to online retailers on Cyber Monday came from mobile devices. (OuterBox)
16. Mobile traffic converts at less than half the rate of desktops.
The mobile conversation rate is at 2.25% as opposed to the one on desktops at 4.81%. Add to cart rates for mobile are very close to those of desktop, though—the average add to cart rate for mobile is 10.4% and 11.87 for desktop, which means that the biggest issue for mobile shoppers happens during the checkout process. (SalesCycle)
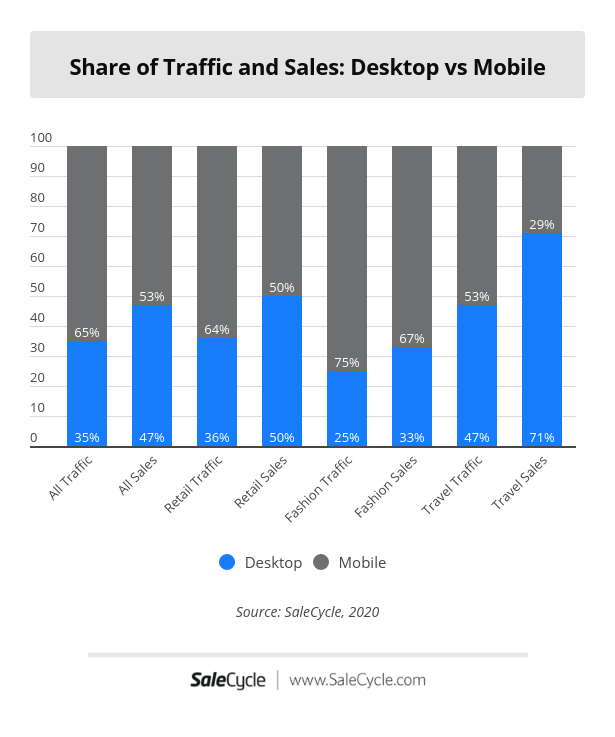
17. Mobile traffic and sales have increased in 2020.
Mobile traffic has gone up from 51.3% in 2021 to 65%, while sales have increased from 36.8% to 53%. The biggest gap between mobile traffic and sales can be seen in Travel, where 53% of visits came from mobile but only 29% of sales, suggesting that more complex products and services are still purchased on desktops. (SalesCycle)
Local Mobile Search Statistics 2022
18. 21% of consumers in the US used the internet to find a local business almost every day.
35% of respondents said they use the net to find local businesses several times a week and just 1% said they never go online for this purpose. (Statista)
19. 82% of shoppers who used their smartphone to help them shop carried out ‘near me’ searches on their mobile device.
This figure is even higher among Millennials, 92% of whom searched for “near me” on their smartphones or tablets when shopping.
Other facts and stats on local Google searches reveal that:
- 75% of smartphone owners use search to meet their immediate needs.
- 30% of mobile searches are related to location.
- 76% of consumers who do a “near me” search on a mobile visit a related business within a day.
- 28% of those visits result in a purchase.
- 88% of people who do a local search on their mobile phone visit a related store within a week.
- 60% of smartphone users have contacted a business directly using search results. (Think with Google)
20. “Near me” searches grew by 136%.
Google reports other growth in “near me” searches, including:
- Mobile searches for “best place to buy” have gone up by 70% in just two years.
- Mobile searches containing the words “not working” have increased by 65% in two years.
- “Near me” mobile searches that contain variants of “can I buy” or “to buy” have increased by 500%.
- A 150% increase in mobile searches for “___ near me now” was recorded in 2018
- Mobile searches for “___ near me today/tonight” increased by 900%
- A 200% increase was seen in mobile searches for “Open” + “now” + “near me”
- Car-dealer-related “near me” mobile searches grew by 200%
- Mobile searches for “on-sale” + “near me” went up by 250%
- A 600% increase in dress-related “near me” mobile searches was noted (Think with Google, Uberall)
21. Among “near me” searches, 84% were food searches.
Food is followed by
- Entertainment:56%
- Banking: 50%
- Apparel: 41%
- Personal care 38%
On top of that, 48% of “near me” searches were searched for “a specific retailer or store”.
Searches for products were up next with 29%, followed by searches for a specific brand with 23%. (Uberall)
22. 93% of “near me” searches result in clicks on the first set of results.
60% of respondents in a survey said they are very likely to click on the first two to three search results in a “near me” search. 33% said they were “somewhat likely” whereas only 2% said they wouldn’t click. (Uberall)
Mobile vs Desktop Statistics
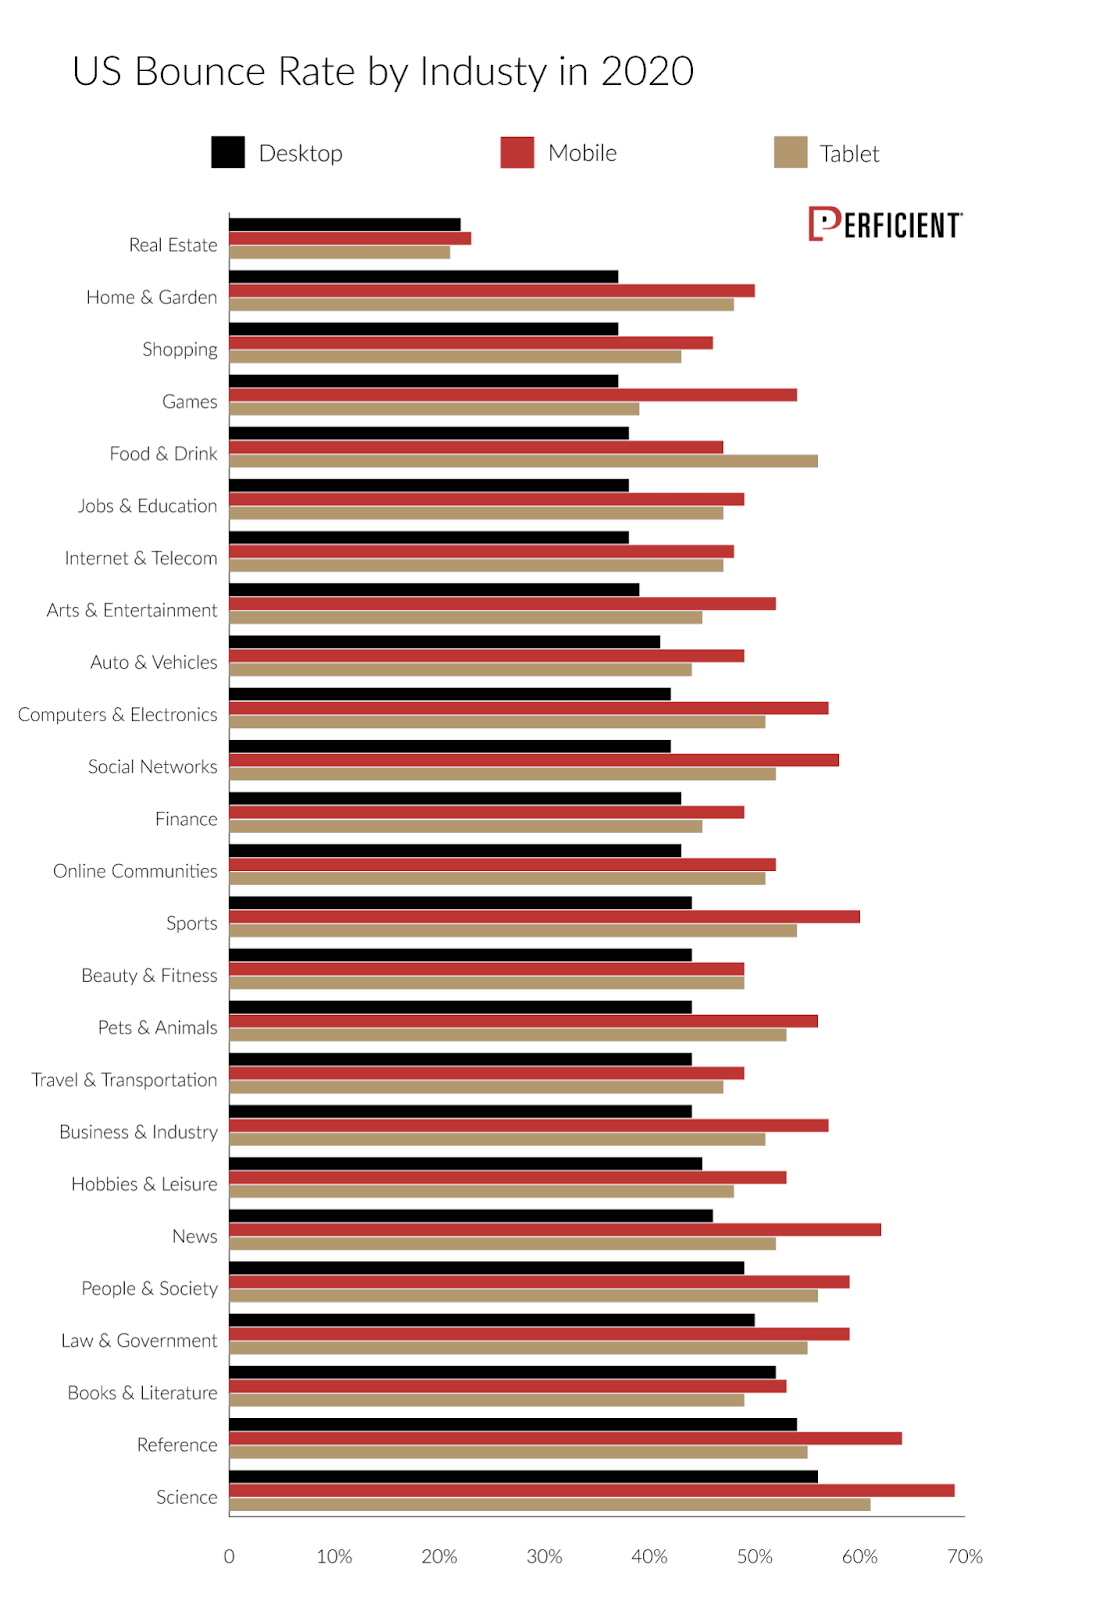
23. Between 2018 and 2020, visits via mobile noted a 3% higher bounce rate compared to desktop visits.
This gap went down to 0.2% by the end of 2020 which means brands need to do more to make content on mobile more appealing. The bounce rate on mobile is higher than that of desktop across all categories, Perficient reports, with the only exception being books & literature and real estate. (Semrush, Perficient)
24. Weather sites get 80% of mobile searches while B2B topics get less than 50%.
B2B software and B2B sales are the only areas where desktop searches dominate, which shows that the relevance of mobile searches is varied across industries. (SISTRIX)


25. Mobile users see more images and videos in organic search than desktop users.
Mobile users tend to see 12.5 times more images in organic search and three times more videos than desktop users. On the other hand, desktop users were twice as likely to see a Google ad and a Featured Snippet on their devices.
The choice of device was not that important when it comes to Top Stories and Local Pack as these show up with the same frequency on desktop and mobile. (Semrush)
26. More complex topics are searched on desktop.
Keywords for which Google displays boxed with job advertisements or booking flights are searched more on desktop—in this area, a little over half of all searches are carried out on phones.
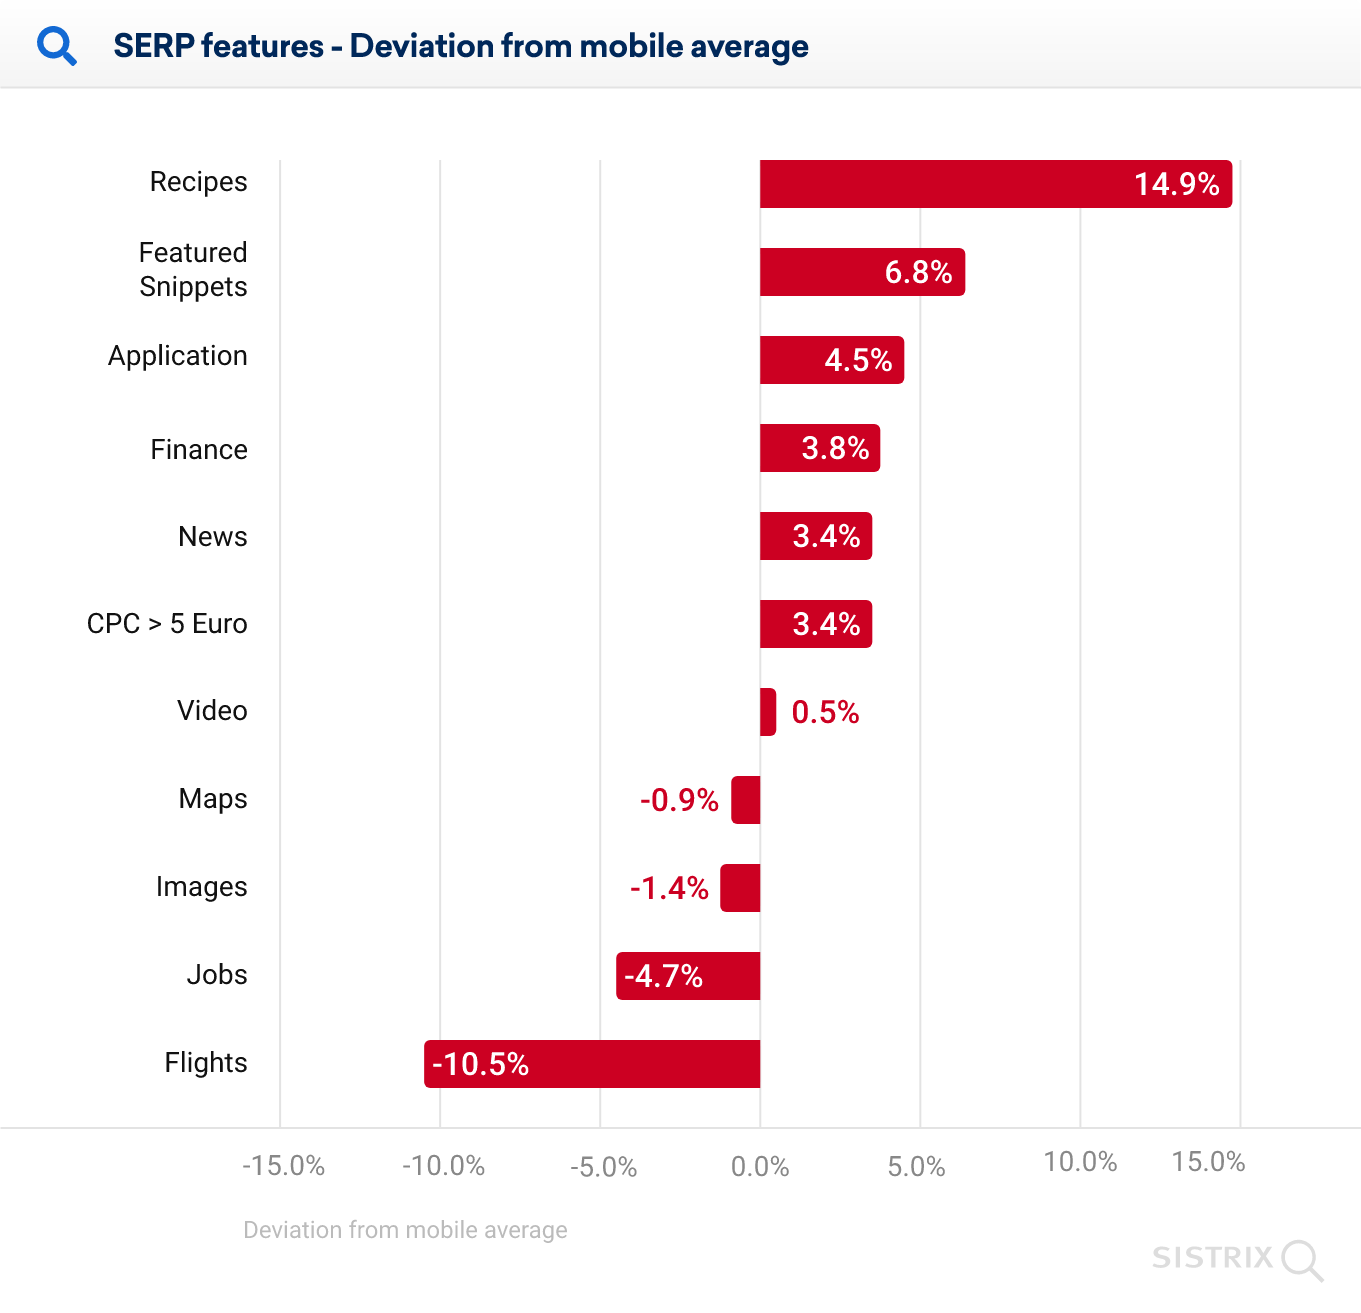
However, keywords for which Google shows a featured snippet (+ 6.8%), a Google application (+ 4.5%), or recipe box (+ 14.6%) have an above-average frequency among mobile searches. Actually, nearly 80% of all searches with a recipe integration are done on cell phones. (SISTRIX)
Mobile SEO Statistics
27. 30% of pages that come up on the first Google page on desktops do not show up in the top 10 results on mobile devices.

On top of that, only 11% of pages kept the same ranking across desktop and mobile search, while 31% of URLs and 8% of domains were gone from Google’s search results when accessed from mobile devices.

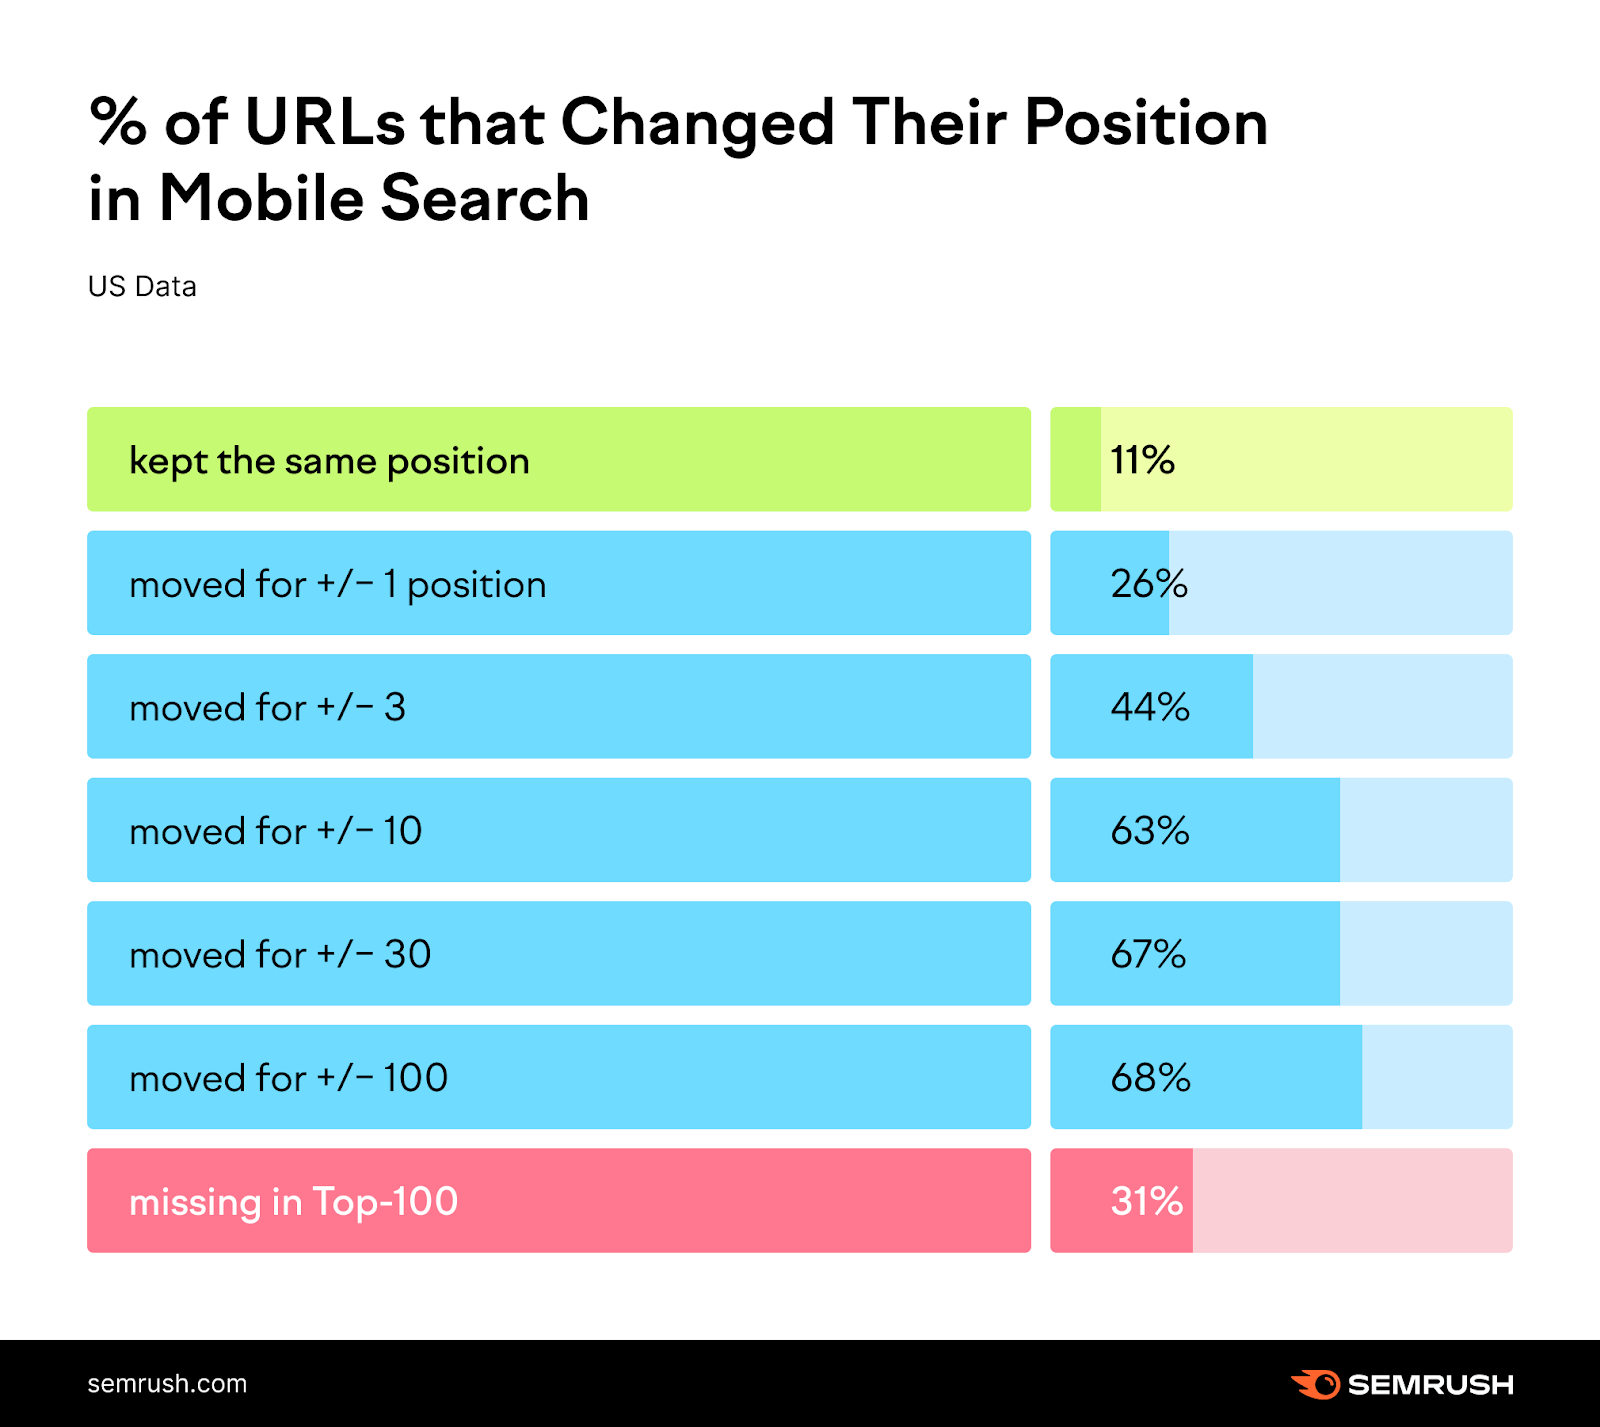
Losing rankings is even worse on mobile devices due to the screen’s reduced real estate. (Semrush)
29. 35% of all desktop clicks end up on the first organic hit.
On mobile, however, less than 30% of clicks go to the first organic hit. Mobile users seem to skip the first answer offered by Google and search for more organic results below. Since they scroll down they don’t necessarily click on the first result either.
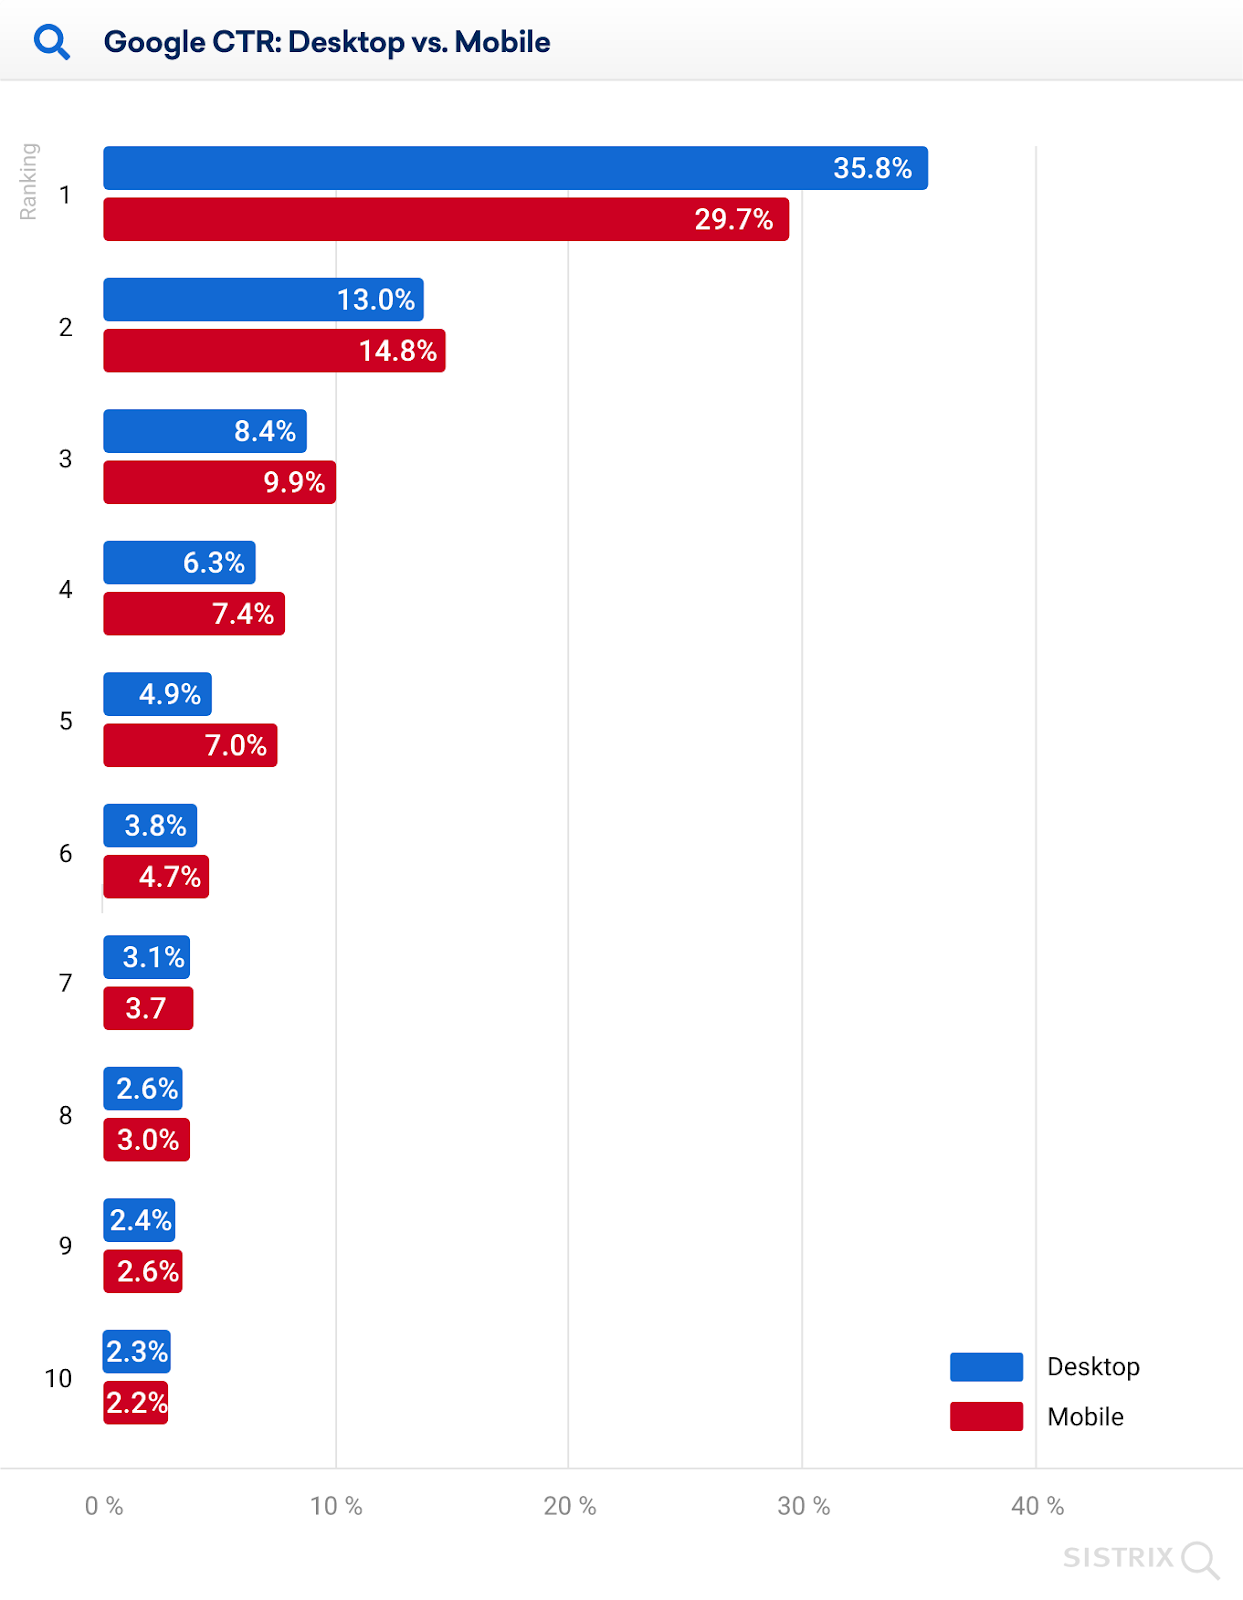
Carrying out a new search is also a factor here. Desktop users would more likely start a new search than scroll down, whereas starting a new search on mobile requires more effort. (SISTRIX)
28. Mobile is nearly twice as important as desktop at the keyword level.
According to an analysis of 84,637,700 examined keywords carried out by Sistrix, just 27% of desktop searches were more important than mobile searches. For the keywords in question, desktop searches made up over 55% of searches, whereas mobile searches made up a maximum of 45%.

On the other hand, the percentage of keywords in which searches on phones characterize the keyword are more than double. I.e. 57% of all keywords are mobile phone searches in which the majority of searches came from a smartphone or tablet. ( SISTRIX)
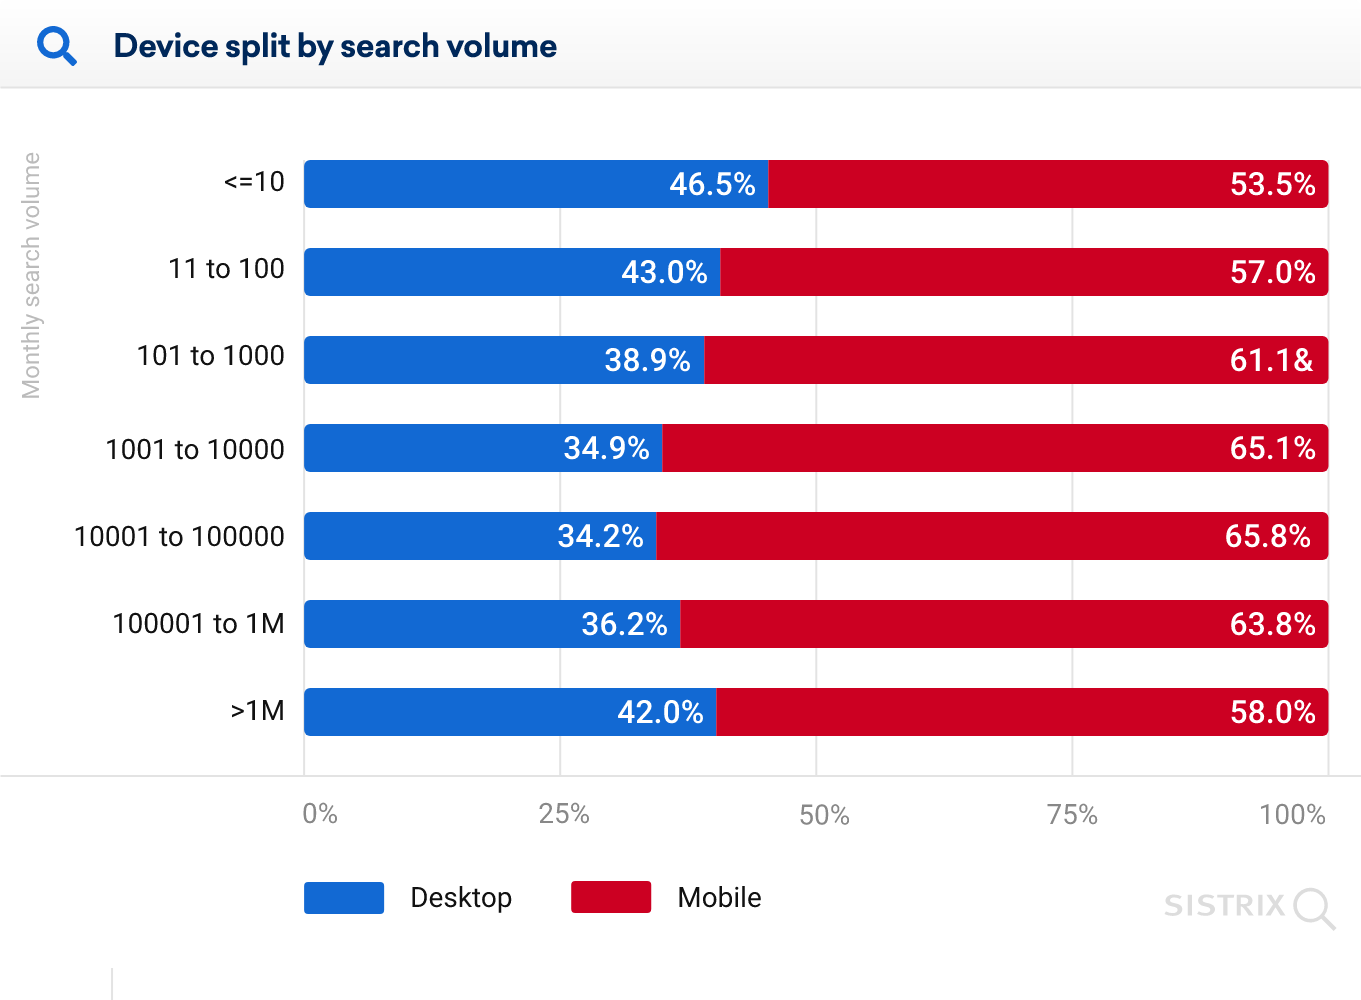
30. For the majority of keywords, there are more searches on mobile than desktop.
For 17.6% of keywords, the distribution is 60% vs 40% across mobile and desktop, respectively.
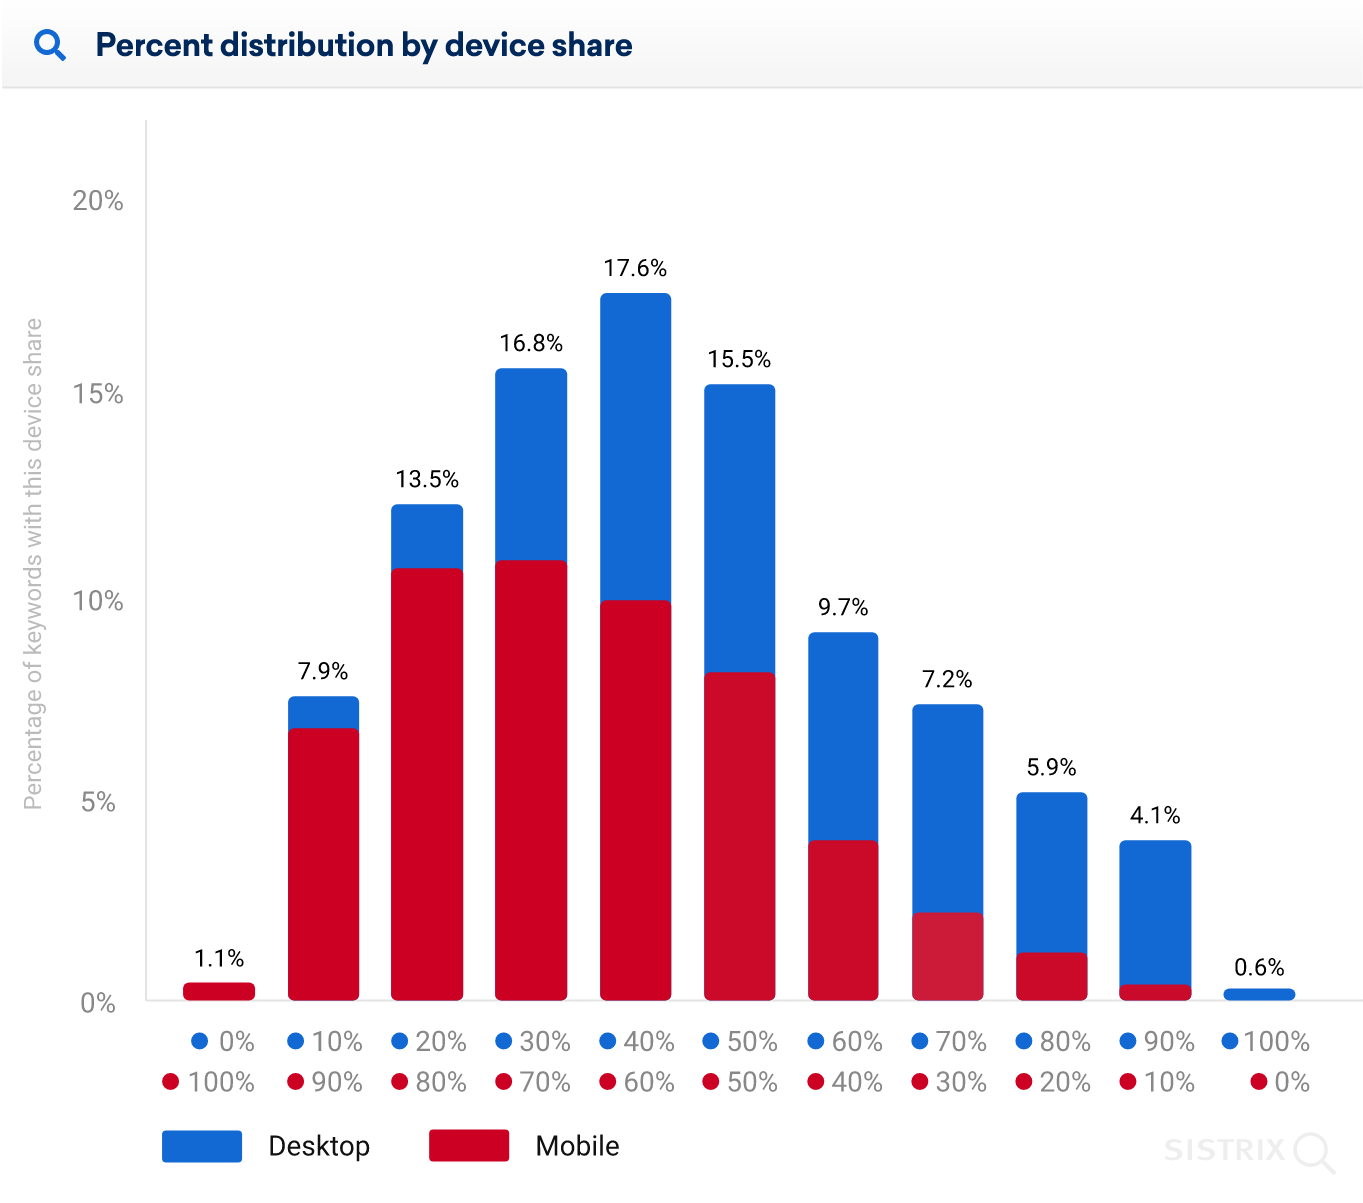
When it comes to search volume, however, mid-tail searches (around 1,000 and 100,000 searches a month) have an above-average number of mobile phone searches, while desktop searches have higher long-tail searches. (SISTRIX)
Some Final Tips:
Desktop use may have picked up in 2020, but there is no doubt that the future is mobile.
Here are a few things to consider in the mobile-first era:
1. See how the competition is performing:
If key players in your niche are getting over 50% of their traffic from mobile and you are getting 30% or less, review your site for potential issues, such as slow loading speed or site architecture.
2. Optimize the checkout process on mobile:
Statistics reveal that as many as 84% of consumers have experienced issues when completing a mobile transaction. Plus, 59% of shoppers in a survey said that being able to shop on smartphones is an important consideration when choosing which brand to buy from.
Pair this with the fact that 40% of consumers said they would go to a competitor after having a bad mobile experience, and it becomes clear why having a mobile responsive website is a must for any business.
3. Build omnichannel marketing:
Just because mobile use is increasing doesn’t mean that you should neglect desktop strategies. In reality, consumers use both mobile and desktop so make sure that there is seamless integration between the two.
4. Track mobile performance
Despite a mobile-first approach, many tools continue to provide desktop data. Ensure that you are tracking the right numbers.
5. Think small screen:
It can be hard to walk away from the monitor once you are used to it, but the more you use your site on mobile, the easier it will be to spot any weaknesses.