With all kinds of new means of communication around, email is still going strong. Every day 347 billion emails are sent every day. These numbers become even big when B2B. Office employees get over 121 emails per day and send over 40 per day in 2023.
Considering the above numbers, Email Marketing is big for B2C and even more for B2B. So let’s look into some email marketing statistics in the following categories to help you optimize your next campaign.
- Email open rate Statistics
- Email click-through rates
- Email conversion rates
- Email newsletter Stats
- Email marketing benchmarks by industry
Email open rate statistics
- Email open rates massively depend on the subject line. 69% of people consider email as spam purely based on the email subject line.
- Emails are sent by 82% of marketers with no more than 60 characters in the subject line.
- According to Experian’s study, subject lines with emojis have raised the open rate percentage by 56% when compared to text-only subject lines.
- The average open rate is 19.49% for emails sent in North America.
- People love their pets, and the highest email open rate is 22.1% for pet and animal services.
- Checking email has become a complementary activity. 69% of the people open email while watching TV, 57% in Bed, and 79% on vacation.
- According to a study by Campaign Monitor, $44 is earned in email marketing for every $1 spent.
- The open rate for businesses on average in cross-industry is 20% and in the daily deals industry is 15%.
- Consumers around 28% would like to receive promotional emails more than once a week.
- In 2020, 20.94% is the average open rate across all industries.
- Real estate and Education industries have the highest open rates with 26% and 25% when compared to computer/electronics.
- The average open rate for the electronics and computer industry is 19% which includes companies like computer games, consumer electronics, computer hardware, electrical or electronic manufacturing, nanotechnology, or semiconductors.
- The business category has an average open rate of 20% with services like marketing, editing, consulting, writing, and more.
- The average open rate for the media category and computer software category is 21% and 20% respectively.
- 21% is the average open rate of the internet and telecom industry which include media, internet, wireless, and telecommunications.
- The average open rate for the healthcare industry is 21% which includes all the companies like the hospital, medical devices, medical practices, veterinary, or mental healthcare.
- The average open rate for email, finance, and manufacturing categories is 23% for each category.
- The open rate percentage from mobile or tablet devices continues to grow each year. Since 2011 email open rates from mobile have increased by more than 100%.
Email Click-through rate statistics
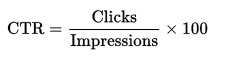
Email Click-through rate (CTR) can be calculated as the ratio of clicks on the email link to the impressions the email link makes. Then multiply by 100 to get the average.
- Instead of simple text, adding a call-to-action button in emails would lead to an increase in click-through rate by 28%.
- More images in the emails may tend to decrease in the email click-through rates.
- CTR is the most important metric which should be monitored when implementing paid customer acquisition.
- The ad’s average CTR on search networks with 1.91% is higher than the display network with 0.35%.
- The highest CTR average is for Twitter ads with 2%. LinkedIn has a low CTR of 0.06%. The reason for low CTR may be because of limited outreach opportunities for advertisers.
- Facebook offers multiple types of ads. Facebook link ads CTR is 0.72%, video ads CTR is over 2%, beating Twitter’s CTR at 2.21%.
- According to MailChimp, the Hobbies industry with 5.13% has the highest CTR for emails and the Restaurant Industry with 1.25% has the lowest.
Email conversion rate Statistics
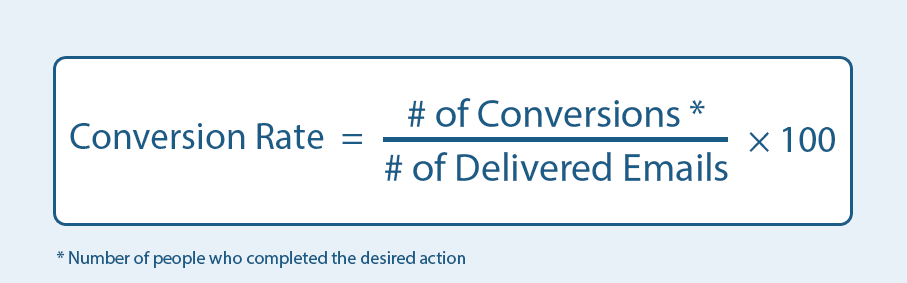
- Email conversion rate refers to the percentage of subscribers who complete the desired action or become customers depending on the conversion goal.
- It can be calculated by the number of people who completed the desired conversions(signups, purchases, etc.) by the total number of emails delivered successfully. Then multiply that number by 100.
- According to the study of 1 billion emails, video emails have 96% higher CTRs than non-video emails.
- In 2018, the average conversion rate peaked at 18.49%. Then in 2019 and 2020, it had a significant pullback. 2020 still has a respectable conversion rate of 15.11%.
- Email accounted for 19.8% of all transactions according to Custora E-commerce Pulse, trailing only organic traffic(21.8%) and paid search(19.9%).
- “Email my Cart” is the most effective triggered email type by conversion rate with 24.58%. Customers demonstrate the purchase intent and would have added the items to their cart.
- “Cart Abandonment Emails” with 18.5% has the second-highest conversion rate. Customers have filled out the purchase form but decided not to follow.
- “Browse Abandonment Emails” with a 4.1% conversion rate also triggers the conversion rate. Customers show less intent, not adding any items to their cart.
Email newsletter statistics
Newsletter stats show just how effective email can be for retaining readers, engaging your audience, and converting paid subscribers.
- Email newsletters are used by 77% of the Business-to-Business (B2B) marketers for content marketing
- Publisher newsletters have an open rate of 22%, according to industry benchmarks. So, 22% of the email audience can see the content when compared to Facebook audience percentage.
- The PostUp client 1440 Media earns an open rate of 50% and the Washington Post’s newsletters average open rate is 30%. PostUp clients get 2X of page views per session from email when compared to other channels.
- Visitors from Greentech Media’s newsletter spend 80% more time on-site than other channel visitors. This can help the site for more page views and more revenue.
- On average, 110 seconds are spent on the site by Vox’s newsletter readers compared to 40 seconds for Facebook visitors. As social media people just tend to skim through the site.
- Readers from Vanity Fair’s newsletter consume 2X more content than any other audience. News alerts were sent to readers by their automated email program when a celebrity they follow is in the news.
- If the New York Times readers subscribe to the newsletter first, then they are 2X more likely to become paid subscribers. Well, global reputation and name recognition pay off.
- When compared to Facebook visitors, the Seattle Times visitors referred are 25X more likely to get into paid subscriptions. Visitors from Facebook aren’t likely to pay for the content.
- According to Lenfest Institute, paid subscribers would increase when the readers read more than 5 articles per month or provide their email address.
- Getting the visitors back once or twice during the trail New Yorker subscriptions increases the retention rate by 7%. This helps to connect directly with the audience and re-engage lapsed subscribers.
- The retention rates increased by 140% when the Globe and Mail emailed subscribers at the risk of churning. They generated automated email re-engagement programs to nudge the disengaged audience.
Email marketing benchmarks by industry
- In 2019, Government Businesses continue to dominate email open rates globally. The top three industries with the highest open rates are Government with 30.5%, nonprofits with 25.2%, and Education with 23.4%.
- Consumer packaged goods which saw the least open rates, have been consistent enough with 14.5% open rates and have made out of the bottom three.
- Automotive and Aerospace industry dropped down in open rates from 17% to 12.6% in 2019.
- Food and Beverage open rates with 13% vs 15.5% last year as well as Retail with 14% vs 15% last year experienced lower open rates in 2019.
- Click through rates for the government have improved from 3.04% to 4.1% in 2019.
- Real estate, Design, and Construction click-through rates improved from 18.88% to 19.9% this year.
- In 2019, Agriculture, Fishing, Forestry, and Hunting click-through rates remained almost consistent, decreasing from 3.66% to 3.5%.
- Tuesdays not only see the Highest open rates but also the highest unsubscribe rates. Marketers should stop chasing for “best day” and focus on following email marketing best practices.
- Improvement in bounce rates and unsubscribers has been seen. Bounce rates improved by 0.36% and only 0.08% unsubscribers were seen in our emails.
- In 2019, the best numbers and big improvements were seen. Whatever the email marketing strategy there’s always room to improve. Subscribers would love to see your brand as a must-read resource. Then the best and most useful emails will get high open rates and click-through rates.
Conclusion
So there you go!
The science behind the email open rate and click-through rate has been provided for email marketing.
Key points to increase email open rates:
- To get the best open rate, 6-10 words could be used as a subject line.
- Send the email campaigns during the business day after lunch.
- Optimizing the email campaigns for mobile would increase the open rate.
- Use a recognizable sender name.
- Include social sharing buttons in emails to increase click-through rates.
References: